Weekly market view
|
|||||||||||||||||||||||||||||||||||||||||||||||||||||||||||||||||||||||||||||||||||||||||||||||||||||||||||||||||||||||||||||||||||||||||||||||||||||||||||||||||||||||||||||||||||||||||||||||||||||||||||||||||||||||||||||||||||||||||||||||||||||||||||||||||||||
|
Jan 03, 2004 |
|||||||||||||||||||||||||||||||||||||||||||||||||||||||||||||||||||||||||||||||||||||||||||||||||||||||||||||||||||||||||||||||||||||||||||||||||||||||||||||||||||||||||||||||||||||||||||||||||||||||||||||||||||||||||||||||||||||||||||||||||||||||||||||||||||||
The value of shares advancing was Rs. 30,134 crores and the value of shares declining was Rs. 10044 crores. This indicates a broader buying bias. The total traded volume on the BSE was Rs. 13036 Crores. The total traded volume on the NSE was Rs. 27273 Crores.
The markets created a record of sorts as the indices surpassed previous highs and close at new milestone levels. The traded volumes were higher, the market breadth was positive and the undertone was highly positive. The rally was mainly due to the old economy segment, mainly the oil and gas stocks. The software stocks brought up the rear and the markets bid a cheerful goodbye to the year 2003. The Sensex was boosted by ACC, Bharati Tele, BHEL, BSES, Cipla, Dr Reddy, Grasim, Gujarat Ambuja Cements, HDFC Bank, Hind Lever, HPCL, Hindalco, ICICI Bank, Infosys, ITC, L&T, MTNL, ONGC, Ranbaxy, Reliance, Satyam Computers, SBI, Telco, Tata Power, Tisco, Wipro and Zee Telefilms. The Sensex was dragged down by Bajaj Auto and HDFC. The rupee ended the week at 45.70 levels ( ) against the US $. Overall, the week was in line with our expectations, click here to view our previous weeks report.
Changes in outstanding futures positions.
Stars of the week
The markets are in a new trading zone and there is little or no resistance on the upside as there is no available historical data at such high levels. The only hurdle to the upmove is from weaker bulls who will book profits and wait for lower levels. The FII's have continued to pump in money and buy till the last day of year 2003. The outstanding long positions as shown in the table above are climbing steadily. The only indicators of profit taking or hedging are from the Nifty positions which show a near even position on the long and short outstandings. The immediate trend determination for the markets will also come from the reported early elections and the vote of account which is slated for January end itself. If these events be confirmed, the markets are likely to turn volatile. The overall trend however, will remain positive. The overseas markets are firm and therefore will limit the downside if any, due to corrective forces. The US markets are also trending higher on the back of positive economic data. The overall outlook is therefore positive - baring corrective selling.
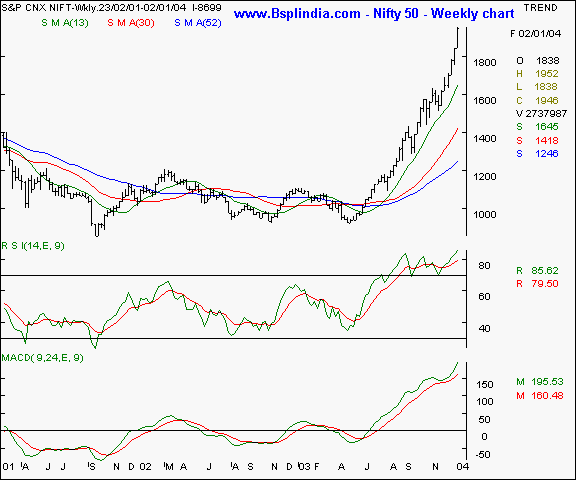
The weekly bar chart of the Nifty shows a rising tops and bottoms formation and that is a typical indicator of bull markets. The oscillators are showing an extremely overbought level and therefore a corrective fall would be in order. Being a bull market, the correction may not last long, but is likely to be highly volatile. The resistance is likely to come at the 1975 levels and above at the 2010 levels. On the downside, support will be seen at the 1800 levels. The risk to reward ratio is therefore getting slim. Our outlook on the Nifty is that of caution and we do not advocate fresh positions at this level. Let your profits run on existing positions with protective stop losses in place.
For stock specific recommendations, please refer to our special edition - "Flavours of the week". Click here to view the previous editions of the flavours of the week Your feedback is important ! Please click here to let us know your views. Click here to inform a friend about this page on our website.
The author is a Mumbai based investment consultant and invites feedback at Vijay@BSPLindia.com and ( 022 ) 23438482 / 23400345. SEBI disclosure - The author has no positions in the stocks mentioned above.
Legal notice :- The Professional Ticker Reader is a trademark of Bhambwani Securities (P) Ltd. and any un-authorised replication / duplication in part or full will be infringing our trademark and will result in legal action being enforced on the infringing persons / parties. |
|||||||||||||||||||||||||||||||||||||||||||||||||||||||||||||||||||||||||||||||||||||||||||||||||||||||||||||||||||||||||||||||||||||||||||||||||||||||||||||||||||||||||||||||||||||||||||||||||||||||||||||||||||||||||||||||||||||||||||||||||||||||||||||||||||||
Your feedback is important ! Please click here to let us know your views. Click here to inform a friend about this page on our website.
